RxJS performance, measured: the bottleneck is almost never the operator
 Samuel Santana
One question that shows up under "RxJS performance" is whether RxJS is slow. I measured it. On my machine, each operator in a chain costs between 8 and 12 nanoseconds per value. That is not free, but it is almost never the problem. What I see cost real money in an Angular application is something else: the same request fired three times, a source that keeps running after the screen is gone, a derived value that emits twice (once with the wrong data), and a search box that ends up showing the results for an old keystroke.
This post measures each of those cases with a short script you can run. The version is RxJS 7.8.2, the latest on npm today, October 5, 2026. There has been a 9.0.0-beta.0 under the next tag since August 4, 2026, which I did not measure; and Angular 22.2.1, the current version, declares rxjs as a peer dependency with ^6.5.3 || ^7.4.0, so 9 is not an option in an Angular project yet. Everything ran on Node 24.19.0, on an Intel Core i9-13900H running Windows. Timings depend on the machine. The counts (how many requests, how many emissions, how many teardowns) do not: they are RxJS semantics and come out the same anywhere.
It follows two earlier posts: RxJS vs. Signals, from July, and the operators behind rx-state-bridge, from August.
First, the ruler: what an operator costs
Before talking about what is expensive, it is worth measuring what everyone suspects. The script pushes one million values through chains of 0, 5 and 10 operators, alternating map and filter (the filter always passes, so every value runs the whole chain). Then it compares against the same ten steps written as plain functions, and it measures subscribing and unsubscribing a five-operator chain, which is what an async pipe does on every row of a list. Each case gets five warmup rounds and 21 measured rounds; the output shows the median, the minimum and the maximum.
// node --expose-gc cost.mjs
import { Subject, filter, map } from 'rxjs';

function bench(label, iterations, fn, rounds = 21) {
  for (let i = 0; i < 5; i++) fn(iterations); // warmup
  const ns = [];
  for (let i = 0; i < rounds; i++) {
    const t0 = process.hrtime.bigint();
    fn(iterations);
    ns.push(Number(process.hrtime.bigint() - t0) / iterations);
  }
  ns.sort((a, b) => a - b);
  console.log(`${label.padEnd(38)} median ${ns[rounds >> 1].toFixed(1)} ns (min ${ns[0].toFixed(1)}, max ${ns.at(-1).toFixed(1)})`);
}

// Alternating map/filter; the filter always passes, so every value runs the whole chain.
const ops = (n) => Array.from({ length: n }, (_, i) => (i % 2 ? filter((x) => x >= 0) : map((x) => x + 1)));
let sink = 0;

for (const n of [0, 5, 10]) {
  const subject = new Subject();
  subject.pipe(...ops(n)).subscribe((x) => (sink += x));
  bench(`emit through ${n} operators`, 1e6, (it) => { for (let i = 0; i < it; i++) subject.next(i); });
}

const fns = Array.from({ length: 10 }, (_, i) => (i % 2 ? (x) => (x >= 0 ? x : x) : (x) => x + 1));
bench('same 10 steps, plain functions', 1e6, (it) => {
  for (let i = 0; i < it; i++) { let x = i; for (const f of fns) x = f(x); sink += x; }
});

const piped$ = new Subject().pipe(...ops(5));
bench('subscribe + unsubscribe, 5 operators', 1e5, (it) => {
  for (let i = 0; i < it; i++) piped$.subscribe((x) => (sink += x)).unsubscribe();
});

global.gc();
const before = process.memoryUsage().heapUsed;
const subs = Array.from({ length: 1e5 }, () => piped$.subscribe((x) => (sink += x)));
global.gc();
console.log(`heap per live subscription, 5 operators: ${((process.memoryUsage().heapUsed - before) / 1e5).toFixed(0)} bytes`);
subs.forEach((s) => s.unsubscribe());
emit through 0 operators               median 22.7 ns (min 21.0, max 25.4)
emit through 5 operators               median 64.4 ns (min 62.5, max 66.5)
emit through 10 operators              median 120.7 ns (min 107.3, max 150.2)
same 10 steps, plain functions         median 30.9 ns (min 29.1, max 33.8)
subscribe + unsubscribe, 5 operators   median 494.6 ns (min 475.1, max 595.7)
heap per live subscription, 5 operators: 3265 bytes
I ran the benchmark five times (once with this script, four times with an earlier version that only differs in its labels). The 10-operator median landed between 121 and 144 ns; subscribe-and-unsubscribe, between 484 and 740 ns. Memory per subscription was 3,265 or 3,266 bytes every time.
Reading the numbers:
- Each operator adds 8 to 12 ns per value. Ten operators cost about four times the same steps as direct function calls. The overhead is real.
- At 60 Hz, a frame lasts 16.7 ms. Even at the worst median (144 ns per value), the ten-operator chain would need more than 110,000 emissions inside a single frame to fill it on its own.
- A list of a thousand rows with one
asyncpipe per row, over a five-operator chain, takes between 0.5 and 0.75 ms to set up all thousand subscriptions and holds about 3 MB of heap (a thousand times 3,265 bytes) while they exist.
What the number does not say: it measures RxJS alone, without Angular's change detection and without the DOM. And it was measured in Node. Node runs on V8, the same engine as Chrome, so the order of magnitude should hold in Chrome; the absolute value changes with the CPU and the state of the JIT. Firefox and Safari use other engines, and I did not measure there.
This puts a scale on a sentence from the July post, which lists the memory overhead of each async pipe among the pains of RxJS: "in long lists, this overhead adds up." It adds up, but slowly: a thousand subscriptions cost less than a millisecond to set up. What weighs on a long list is the work each subscription triggers. The rest of this post is about that.
The same request, three times
HttpClient returns cold Observables. The Angular documentation is direct about it: no request happens until something subscribes, and subscribing to the same Observable several times triggers several backend requests, one per subscription. A template with user$ | async in three places makes three requests.
The script below imitates that behavior with an Observable that counts how many times it ran. Three consumers subscribe together, like three async pipes in the same template; a fourth subscribes after the response arrived, like a child component created later.
import { Observable, share, shareReplay } from 'rxjs';

const sleep = (ms) => new Promise((r) => setTimeout(r, ms));

// Behaves like HttpClient: nothing until subscribe, one request per subscribe.
const fakeGet = (stats) =>
  new Observable((subscriber) => {
    stats.requests++;
    const t = setTimeout(() => { subscriber.next({ name: 'Ada' }); subscriber.complete(); }, 50);
    return () => clearTimeout(t);
  });

async function scenario(label, operator) {
  const stats = { requests: 0 };
  const user$ = operator ? fakeGet(stats).pipe(operator) : fakeGet(stats);
  for (let i = 0; i < 3; i++) user$.subscribe(); // three `user$ | async` in one template
  await sleep(100);
  const atOnce = stats.requests;
  user$.subscribe(); // a component created after the response arrived
  await sleep(100);
  console.log(`${label.padEnd(46)} 3 at once: ${atOnce} | +1 late: ${stats.requests} total`);
}

await scenario('no sharing', null);
await scenario('share()', share());
await scenario('shareReplay(1)', shareReplay(1));
await scenario('shareReplay({ bufferSize: 1, refCount: true })', shareReplay({ bufferSize: 1, refCount: true }));
no sharing                                     3 at once: 3 | +1 late: 4 total
share()                                        3 at once: 1 | +1 late: 2 total
shareReplay(1)                                 3 at once: 1 | +1 late: 1 total
shareReplay({ bufferSize: 1, refCount: true }) 3 at once: 1 | +1 late: 1 total
Three things in that table deserve attention.
share() handles whoever arrives together, not whoever arrives later. The fourth subscriber fired another request. That is the operator's default: in the share source, resetOnComplete starts as true, and the ShareConfig documentation explains that, with it on, the Observable goes back to a "cold" state when the source completes. An HTTP request completes right after the response.
shareReplay(1) keeps the last value and hands it to latecomers. The shareReplay documentation states the price: a source that completed successfully stays cached in the shared Observable forever. A source that errored can be retried.
refCount: true does not turn that cache off. The fourth subscriber got the cached value with no new request, even with refCount: true and even though the subscriber count had dropped to zero before it arrived. The reason is in the share source: the reset on a zero count only happens if the source has neither completed nor errored. In other words, refCount decides what happens to a live source when everyone leaves. It does not decide whether a request's result stays cached.
In the template, the cheapest fix does not even need an operator. It is a single subscription with an alias:
@if (user$ | async; as user) {
  <app-avatar [user]="user" />
  <h2>{{ user.name }}</h2>
  <app-permissions [roles]="user.roles" />
}
The other is to call toSignal once, in a class field, and read the signal wherever it is needed. The interop documentation warns that toSignal creates a subscription, so it should not be called repeatedly for the same Observable. One detail about the alias: @if does not render the block when the value is falsy. For a user object, fine; for a counter that can be zero, not fine.
shareReplay without refCount: a leak, not slowness
shareReplay's default refCount is false. The documentation says what that means: when the subscriber count drops to zero, the source is not unsubscribed, and the inner ReplaySubject may run forever. It is a deliberate choice, meant to keep expensive-to-set-up sources alive. The problem starts when it is used where nobody wanted that.
I measured two cases. In case A, the user leaves the screen 20 ms after the request starts, and the request would take 100 ms. In case B, the source never completes: an interval stands in for polling or a websocket. The screen is mounted and unmounted a thousand times, and on each mount two subscribers come and go.
// node --expose-gc refcount.mjs
import { Observable, interval, shareReplay } from 'rxjs';

const sleep = (ms) => new Promise((r) => setTimeout(r, ms));
const timers = () => process.getActiveResourcesInfo().filter((r) => r === 'Timeout').length;
const heapMiB = () => (global.gc(), process.memoryUsage().heapUsed / 2 ** 20);

const variants = {
  'shareReplay(1)': () => shareReplay(1),
  'shareReplay({ bufferSize: 1, refCount: true })': () => shareReplay({ bufferSize: 1, refCount: true }),
};

// A) The user leaves while the request is still in flight.
for (const [label, op] of Object.entries(variants)) {
  let aborted = 0, processed = 0;
  const req$ = new Observable((s) => {
    let done = false;
    const t = setTimeout(() => { done = true; processed++; s.next('data'); s.complete(); }, 100);
    return () => { if (!done) aborted++; clearTimeout(t); };
  }).pipe(op());
  const sub = req$.subscribe();
  await sleep(20);
  sub.unsubscribe(); // component destroyed
  await sleep(150);
  console.log(`A ${label.padEnd(46)} aborted: ${aborted} | processed anyway: ${processed}`);
}

// B) A source that never completes (polling, websocket), 1,000 mount/unmount cycles.
for (const [label, op] of Object.entries(variants)) {
  const baseTimers = timers(), baseHeap = heapMiB();
  let ticks = 0, teardowns = 0;
  for (let i = 0; i < 1000; i++) {
    const ticker$ = new Observable((s) => {
      const sub = interval(10).subscribe((n) => { ticks++; s.next(n); });
      return () => { teardowns++; sub.unsubscribe(); };
    }).pipe(op());
    const a = ticker$.subscribe(), b = ticker$.subscribe();
    a.unsubscribe(); b.unsubscribe(); // every consumer is gone
  }
  const atExit = ticks;
  await sleep(500);
  console.log(`B ${label.padEnd(46)} teardowns: ${teardowns}/1000 | live timers: ${timers() - baseTimers}` +
    ` | callbacks in the next 500 ms: ${ticks - atExit} | retained: ${(heapMiB() - baseHeap).toFixed(2)} MiB`);
}
process.exit(0); // the leaked intervals would keep Node alive forever
A shareReplay(1)                                 aborted: 0 | processed anyway: 1
A shareReplay({ bufferSize: 1, refCount: true }) aborted: 1 | processed anyway: 0
B shareReplay(1)                                 teardowns: 0/1000 | live timers: 1000 | callbacks in the next 500 ms: 32000 | retained: 2.66 MiB
B shareReplay({ bufferSize: 1, refCount: true }) teardowns: 1000/1000 | live timers: 0 | callbacks in the next 500 ms: 0 | retained: 0.05 MiB
In case A, with shareReplay(1), the request ran to the end and the response was processed for nobody. With refCount: true, it was aborted. With HttpClient, unsubscribing before the response aborts the in-progress request (it is in the same requests guide), but only if the unsubscribe reaches the source. shareReplay(1) stops that unsubscribe halfway.
In case B, the source's teardown did not run once in a thousand mounts. A thousand timers stayed alive, firing 32,000 callbacks in the following 500 ms (on this Windows machine, the 10 ms interval fired roughly every 16 ms), and 2.66 MiB of heap stayed retained after garbage collection, against 0.05 MiB with refCount: true. That is not operator slowness. It is work that never stops, and it grows with every navigation.
Note that, for memory, case A is nearly harmless: the request completes and the source stops on its own. A real leak needs a source that does not complete. Polling, websockets, form valueChanges, Router.events and store selectors are sources like that. The rule I follow: in a component, or in anything that lives shorter than the application, shareReplay({ bufferSize: 1, refCount: true }). refCount: false only for a cache that should last the whole application, on purpose.
takeUntilDestroyed in the wrong place
takeUntilDestroyed completes the Observable when the context that called it (component, directive, service) is destroyed. In the @angular/core 22.2.1 source, the implementation is literally source.pipe(takeUntil(destroyed$)). That is why its position in the pipe matters as much as takeUntil's, and why a Subject standing in for the DestroyRef reproduces the behavior:
import { Subject, interval, switchMap, takeUntil } from 'rxjs';

const sleep = (ms) => new Promise((r) => setTimeout(r, ms));
const timers = () => process.getActiveResourcesInfo().filter((r) => r === 'Timeout').length;

async function scenario(label, build) {
  const route$ = new Subject();     // e.g. route params
  const destroyed$ = new Subject(); // e.g. DestroyRef.onDestroy
  const pollOrder = () => interval(10); // polling an endpoint every 10 ms
  const baseTimers = timers();
  let received = 0;
  build(route$, destroyed$, pollOrder).subscribe(() => received++);

  route$.next('order-42');
  await sleep(100);
  destroyed$.next(); // component destroyed
  const atDestroy = received;
  await sleep(300);
  console.log(`${label.padEnd(34)} values after destroy: ${received - atDestroy} | timers still running: ${timers() - baseTimers}`);
}

await scenario('takeUntil before switchMap', (route$, destroyed$, poll) =>
  route$.pipe(takeUntil(destroyed$), switchMap(poll)));
await scenario('takeUntil after switchMap (last)', (route$, destroyed$, poll) =>
  route$.pipe(switchMap(poll), takeUntil(destroyed$)));
process.exit(0); // the leaked interval would keep the process alive
takeUntil before switchMap         values after destroy: 20 | timers still running: 1
takeUntil after switchMap (last)   values after destroy: 0 | timers still running: 0
With takeUntil before switchMap, the destroy completed the outer stream, but the inner polling kept going: 20 values in the 300 ms after destroy, and the timer still running when the script ended. The reason is in the switchMap source: the output only completes when the outer stream has completed and there is no active inner subscription. A poll never completes, so neither does the output. With takeUntil last, the unsubscribe travels down the whole chain and the polling stops.
The rule, then: takeUntilDestroyed() is the last operator before subscribe. Or do not subscribe by hand and let the async pipe or toSignal handle it, which is what the requests guide recommends.
The diamond: two emissions, one of them wrong
The combineLatest documentation describes the behavior in one sentence: whenever any input Observable emits, it computes the output from the latest values of all of them. When the inputs derive from the same source, one change in the source becomes two emissions, and the first one pairs a new value with an old one.
In the example, subtotal$ and total$ derive from the same cart. In a consistent state, total - subtotal is always the shipping fee, 10. The script counts how many emissions arrive and how many break that rule, and then repeats the same diamond with Angular's signal and computed, which run in Node with no application at all:
import { BehaviorSubject, combineLatest, map } from 'rxjs';
import { computed, signal } from '@angular/core';

const N = 1000;

// RxJS: two values derived from the same source, combined again.
const cart$ = new BehaviorSubject({ subtotal: 100, shipping: 10 });
const subtotal$ = cart$.pipe(map((c) => c.subtotal));
const total$ = cart$.pipe(map((c) => c.subtotal + c.shipping));
let emissions = 0, inconsistent = 0;
combineLatest([subtotal$, total$]).subscribe(([subtotal, total]) => {
  emissions++;
  if (total - subtotal !== 10) inconsistent++; // consistent state: the difference is the shipping fee
});
emissions = inconsistent = 0; // ignore the initial emission
for (let i = 1; i <= N; i++) cart$.next({ subtotal: 100 + i, shipping: 10 });
console.log(`combineLatest: ${N} updates -> ${emissions} emissions, ${inconsistent} inconsistent`);

// Angular signals: the same diamond with computed.
const cart = signal({ subtotal: 100, shipping: 10 });
const subtotal = computed(() => cart().subtotal);
const total = computed(() => cart().subtotal + cart().shipping);
let evaluations = 0;
inconsistent = 0;
const summary = computed(() => {
  evaluations++;
  if (total() - subtotal() !== 10) inconsistent++;
  return `${subtotal()} / ${total()}`;
});
summary();
evaluations = 0;
for (let i = 1; i <= N; i++) { cart.set({ subtotal: 100 + i, shipping: 10 }); summary(); }
console.log(`computed, read after each set: ${N} updates -> ${evaluations} evaluations, ${inconsistent} inconsistent`);
evaluations = 0;
for (let i = 1; i <= N; i++) cart.set({ subtotal: 5000 + i, shipping: 10 });
summary();
console.log(`computed, read once at the end: ${N} updates -> ${evaluations} evaluation`);
combineLatest: 1000 updates -> 2000 emissions, 1000 inconsistent
computed, read after each set: 1000 updates -> 1000 evaluations, 0 inconsistent
computed, read once at the end: 1000 updates -> 1 evaluation
A thousand cart updates became 2,000 emissions, and half of them carried a total that did not match the subtotal. The effect on screen I did not measure: both emissions happen in the same synchronous task, before Angular renders. What I can state is what happens after the combineLatest: everything there runs twice per change (a tap that writes, a log line, a switchMap that builds a query), and one of those runs receives values that never existed together.
The RxJS fix is not to build the diamond: derive both values in the same map, from the same emission. I ran the variant cart$.pipe(map((c) => [c.subtotal, c.subtotal + c.shipping])) with the same thousand updates: a thousand emissions, none inconsistent.
With signals, the diamond produces no inconsistent read: a thousand evaluations when the computed is read after every set, none wrong, and a single evaluation when it is read once after a thousand sets. That matches what the signals guide describes: a computed value is cached and only recalculated on the next read after a dependency changed. In the July post I claimed that computed is glitch-free; this is the measurement that post was missing.
distinctUntilChanged helps, with one condition
The other way to create extra work is to emit a value equal to the previous one. distinctUntilChanged exists for that, and its documentation says how it compares: with the comparator you pass or, without one, with ===. That last part decides whether it does anything at all:
import { BehaviorSubject, distinctUntilChanged, map } from 'rxjs';

const N = 1000;
function count(label, buildPipe, updates) {
  const source$ = new BehaviorSubject(updates(0));
  let runs = 0;
  buildPipe(source$).subscribe(() => runs++);
  runs = 0; // ignore the initial emission
  for (let i = 1; i <= N; i++) source$.next(updates(i));
  console.log(`${label.padEnd(52)} ${N} updates -> ${runs} downstream runs`);
}

const price = (i) => 101 + (i % 100); // always "expensive"
count('boolean, no distinctUntilChanged', (p$) => p$.pipe(map((p) => p > 100)), price);
count('boolean + distinctUntilChanged()', (p$) => p$.pipe(map((p) => p > 100), distinctUntilChanged()), price);

const state = (i) => ({ user: { name: 'Ada' }, lastSeen: i }); // the name never changes
count('view model + distinctUntilChanged()',
  (s$) => s$.pipe(map((s) => ({ name: s.user.name })), distinctUntilChanged()), state);
count('view model + distinctUntilChanged((a, b) => a.name === b.name)',
  (s$) => s$.pipe(map((s) => ({ name: s.user.name })), distinctUntilChanged((a, b) => a.name === b.name)), state);
boolean, no distinctUntilChanged                     1000 updates -> 1000 downstream runs
boolean + distinctUntilChanged()                     1000 updates -> 0 downstream runs
view model + distinctUntilChanged()                  1000 updates -> 1000 downstream runs
view model + distinctUntilChanged((a, b) => a.name === b.name) 1000 updates -> 0 downstream runs
With a boolean, the operator cuts a thousand downstream runs to zero. With an object built in a map, distinctUntilChanged() without arguments cuts nothing: every map creates a new object, and === between different objects is always false. It becomes an operator that costs something and does nothing. With the comparator, it is back to zero.
The same care applies on the signals side. A signal's default equality is referential (Object.is, according to the guide), so a new object with the same content counts as a change.
Typeahead: switchMap, mergeMap, concatMap and exhaustMap
The last case is concurrency. A search box receives seven keystrokes, one every 70 ms, until it reads "angular". Each query has a fixed latency on the simulated server, chosen to cause a race: the second ("an") is the slowest, 460 ms, and the last ("angular") is the fastest, 100 ms. The script uses virtual time (TestScheduler.run), so it prints exactly the same numbers on every run.
// The same keystrokes and the same server latencies through each flattening operator.
import { NEVER, Observable, concatMap, debounceTime, exhaustMap, map, merge, mergeMap, switchMap, timer } from 'rxjs';
import { TestScheduler } from 'rxjs/testing';

const QUERIES = ['a', 'an', 'ang', 'angu', 'angul', 'angula', 'angular'];
const TYPED_AT = [0, 70, 140, 210, 280, 350, 420]; // one key every 70 ms
const LATENCY = { a: 300, an: 460, ang: 200, angu: 350, angul: 150, angula: 250, angular: 100 };

function run(label, flatten) {
  const scheduler = new TestScheduler(() => {});
  const stats = { started: 0, cancelled: 0, delivered: 0, inFlight: 0, maxInFlight: 0, shown: [] };

  scheduler.run(() => {
    const search = (q) =>
      new Observable((subscriber) => {
        stats.started++;
        stats.maxInFlight = Math.max(stats.maxInFlight, ++stats.inFlight);
        let done = false;
        const response = timer(LATENCY[q]).subscribe(() => {
          done = true;
          stats.inFlight--;
          subscriber.next(q);
          subscriber.complete();
        });
        return () => {
          if (!done) { stats.cancelled++; stats.inFlight--; }
          response.unsubscribe();
        };
      });

    // NEVER keeps the input open, like a real text field (debounceTime flushes early on complete).
    const keystrokes$ = merge(...QUERIES.map((q, i) => timer(TYPED_AT[i]).pipe(map(() => q))), NEVER);
    flatten(keystrokes$, search).subscribe((q) => {
      stats.delivered++;
      stats.shown.push(`${q}@${scheduler.now()}ms`);
    });
  });

  const last = stats.shown.at(-1);
  console.log(
    `${label.padEnd(28)} sent ${stats.started} | not sent ${QUERIES.length - stats.started} | ` +
    `cancelled ${stats.cancelled} | max in flight ${stats.maxInFlight} | ` +
    `screen ends on "${last}"${last.startsWith('angular@') ? '' : '  <-- stale'}`
  );
}

run('mergeMap', (k$, s) => k$.pipe(mergeMap(s)));
run('concatMap', (k$, s) => k$.pipe(concatMap(s)));
run('exhaustMap', (k$, s) => k$.pipe(exhaustMap(s)));
run('switchMap', (k$, s) => k$.pipe(switchMap(s)));
run('debounceTime(200)+switchMap', (k$, s) => k$.pipe(debounceTime(200), switchMap(s)));
mergeMap                     sent 7 | not sent 0 | cancelled 0 | max in flight 5 | screen ends on "angula@600ms"  <-- stale
concatMap                    sent 7 | not sent 0 | cancelled 0 | max in flight 1 | screen ends on "angular@1810ms"
exhaustMap                   sent 2 | not sent 5 | cancelled 0 | max in flight 1 | screen ends on "angula@600ms"  <-- stale
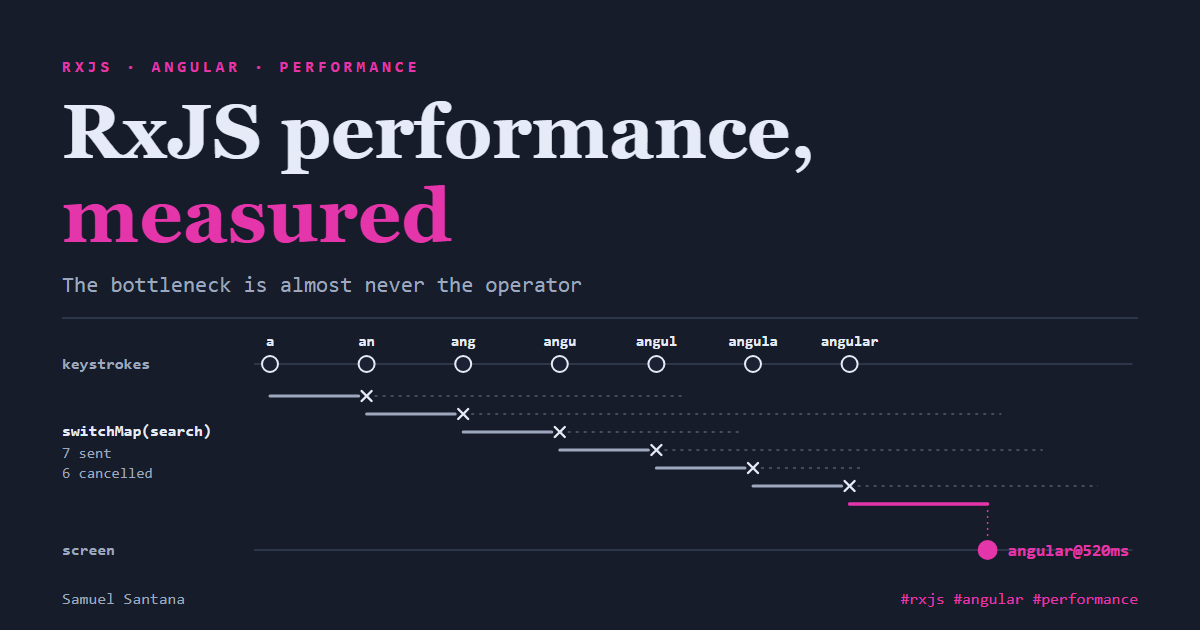
switchMap                    sent 7 | not sent 0 | cancelled 6 | max in flight 1 | screen ends on "angular@520ms"
debounceTime(200)+switchMap  sent 1 | not sent 6 | cancelled 0 | max in flight 1 | screen ends on "angular@720ms"
mergeMap reached five requests in flight at once, and the responses were displayed in the order the server finished them. The screen ends on "angula" at 600 ms: the right response arrived at 520 ms and was overwritten by a slower one. With a local backend answering everything in similar times, this race may never show up in development.
exhaustMap ignores new values while the previous one has not finished (that is its definition in the documentation). It sent two requests and also ended on "angula". Wrong for search, right for a submit button, where the second click should be ignored.
concatMap gets it right, but takes 1,810 ms: the sum of all latencies, because each request waits for the previous one. The documentation also warns that, if values arrive faster than the inner Observables complete, they pile up in an unbounded buffer.
switchMap gets it right at 520 ms. But it sent seven requests and cancelled six. Cancellation happens on the client: HttpClient dispatches the request on subscribe and aborts it on unsubscribe, as the documentation says, but aborting does not undo what the server already received.
debounceTime(200) + switchMap sent a single request and got it right, at 720 ms. The trade is explicit: 200 ms more latency for six fewer requests. Which one is worth more depends on how expensive the query is on the backend.
A trap I fell into while writing the test: in the first version, the keystroke stream completed after the last key, and debounceTime emitted right away, without waiting the 200 ms. The debounceTime documentation describes it: if the source completes during the wait, the last cached value is emitted before the completion. A real text field never completes; the NEVER in the merge reproduces that.
In Angular 22, rxResource has been stable since 22.0 and gives you switchMap semantics without writing it. The resource guide says a resource aborts the outstanding load when its params change, and in the 22.2.1 source that abort unsubscribes from the previous Observable. If the params return undefined, loading does not even start and the status is idle:
import { Component, inject, signal } from '@angular/core';
import { HttpClient } from '@angular/common/http';
import { rxResource } from '@angular/core/rxjs-interop';

interface Product {
  id: string;
  name: string;
}

@Component({ selector: 'app-product-search', template: `...` })
export class ProductSearch {
  private http = inject(HttpClient);
  query = signal('');

  results = rxResource({
    // an empty string becomes undefined: no request, status 'idle'
    params: () => this.query() || undefined,
    stream: ({ params }) => this.http.get<Product[]>('/api/products', { params: { q: params } }),
  });
}
The debounce is still up to you. And one detail the 22.2.1 typings document: if the Observable completes without emitting anything (a catchError(() => EMPTY), for example), Angular throws error NG0991, because the resource is left with neither a value nor an error to show. Anyone migrating a typeahead that swallowed errors with catchError(() => EMPTY) inside the switchMap needs to return a value (of([])) or let the error reach the resource.
Why this matters
The measurements form a staircase. An operator costs nanoseconds. A subscription costs half a microsecond and a little over 3 KB. What costs milliseconds, megabytes or a wrong number on screen is always work: repeated (three requests instead of one), never stopped (a thousand timers after everyone left), emitted too often (two diamond emissions per change) or in the wrong order (mergeMap showing "angula").
None of these shows up in a profiler as "RxJS is slow". They show up as duplicate requests in the network tab, memory that climbs with every navigation, a total that flickers, and a search that shows stale results. That is why, when I investigate RxJS performance, I count instead of timing: how many times the producer ran, how many teardowns happened, how many emissions arrived. Counting is cheap, gives the same result on every run, and holds the same in Node and in the browser. Nanoseconds do not.
References
- RxJS —
shareReplay - RxJS —
shareandShareConfig - RxJS —
combineLatest - RxJS —
distinctUntilChanged - RxJS —
switchMap,mergeMap,concatMap,exhaustMap - RxJS —
debounceTime - Angular — Making HTTP requests
- Angular —
AsyncPipe - Angular —
@if - Angular — RxJS interop (
toSignal,rxResource) - Angular —
takeUntilDestroyed - Angular —
rxResource - Angular — Signals and Resource
- V8
- Source code consulted:
rxjs@7.8.2(src/internal/operators/share.ts,shareReplay.ts,switchMap.ts) and@angular/core@22.2.1(fesm2022/rxjs-interop.mjs,types/rxjs-interop.d.ts)
Comments
Loading comments...